1. Technical means of CSSL
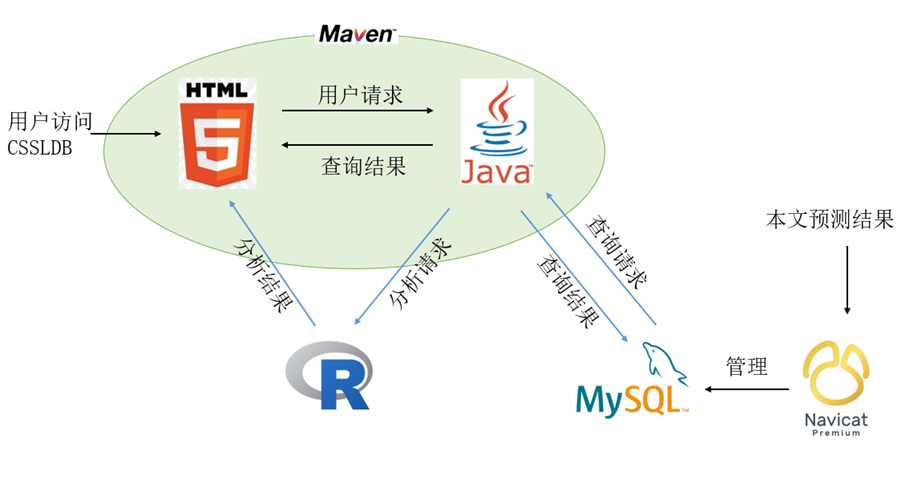
CSSLDB is developed based on Maven and adopts three-tier architecture. Introduction Beautiful front-end interface is based on Bootstrap+jQuery+HTML+CSS development. Autocomplete is implemented using the jQuery.Autocomplete plugin, which allows the user to select a complete gene name after entering the first two digits of the gene name. js provides users with interactive pop-up prompt information, and the pagination function of Page navigation makes the display of results easier to browse. The use of these components, or plug-ins, is the basis for user-friendly access. The backend of CSSLDB is developed by JavaWeb, and the result interface is updated asynchronously by exchanging data with the server by Ajax technology. MySQL database is used to save the relevant data, the database is in line with the third normal form to reduce the coupling, and the index is added to the search field to improve the query efficiency.
2. The results provided by CSSL
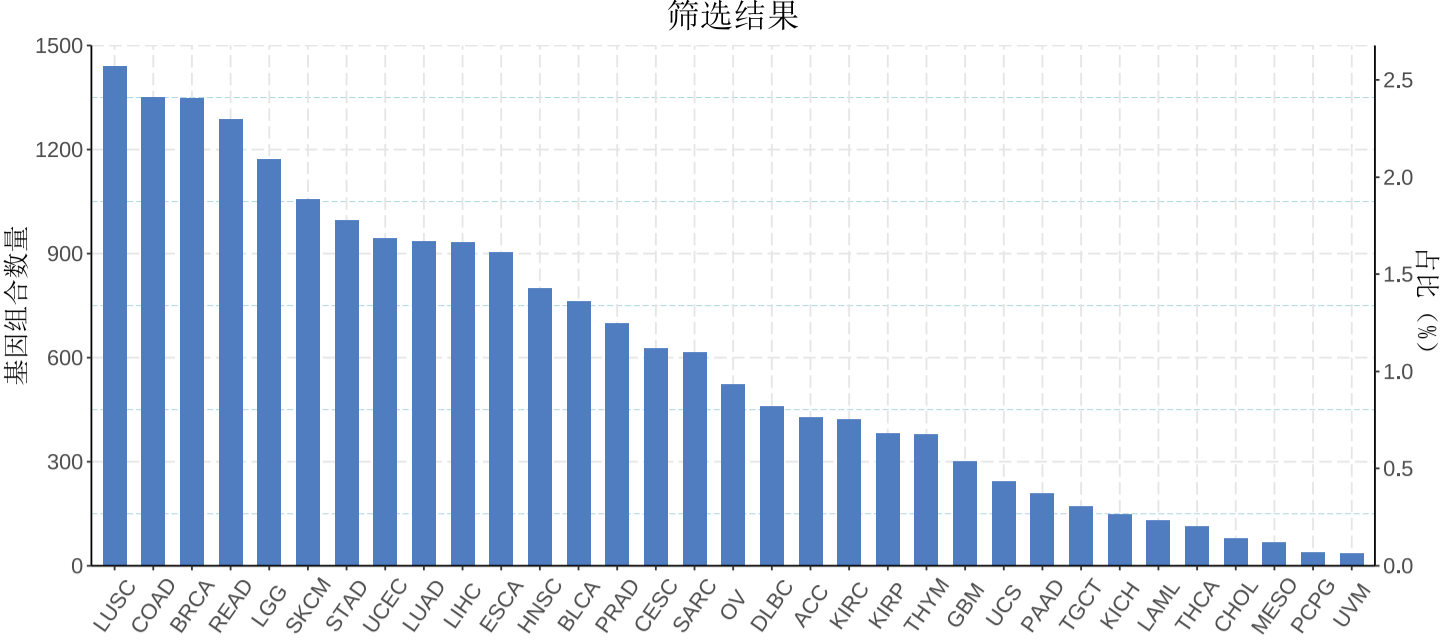
More than 14,000 gene pairs with synthetic lethal interactions were predicted in 33 cancer types. These high quality results can provide more reliable drug targets.
3. Methods of data analysis
3.1 Correlated SL network
The other synthetic lethal interactions of the corresponding gene in the cancer are displayed with an undirected graph, that is, the synthetic lethal interaction network composed of nodes with distance 1 to the relevant gene. Nodes are gene names, green nodes are related genes in the search results, blue nodes are other genes, and edges represent synthetic lethal interactions. The interactive network is built from the networkD3 package, and the link on the left provides network download capabilities.
3.2 Mutual exclusivity analysis
The total number of samples in the mutual exclusivity analysis, the number of samples with changes in each gene, the number of samples with changes in both genes, and the significance p-values of the hypergeometric test are shown. The prompt on the left describes the properties of the sample.
3.3 Differential expression analysis
The results of the difference analysis are shown as boxplots with Log2FC and p-value annotated. The two figures are two control relationships between a set of genes. The expression levels in the analysis were TPM and were tested for differences between groups using the wilcoxon rank-sum test. Where, red is the expression corresponding to samples with non-silent mutations, and blue is the expression corresponding to wild-type samples. The link on the left provides download functionality.
3.4 Survival analysis regarding SL
The results of the survival analysis are presented with KM curves, showing the difference in survival between both genes inactivated (red) and the rest of the sample (blue), providing risk tables and p-values of the Log rank test. The link on the left provides download functionality. Load function.
3.5 Drug-susceptibility analysis
The results of drug sensitivity analysis were presented as box plots. The figure contains drug names, sample information, and p-values for the wilcoxon rank-sum test. Green is the drug response of the mutant sample and orange is the drug response of the wild-type sample. The link on the left provides download functionality.